Kate Dignan has summited one 14er — she thinks it was probably Longs Peak, but she’s done her best to forget the experience.
That trip, and countless photos from hikers around the state, got her wondering: what are those round, metal markers that dot Colorado’s mountains?
“Who actually manages those, determines where they go on the actual mountain,” Dignan asked Colorado Wonders. “There's not a lot of knowledge behind it. I'm sure a Google search could tell me, but it seemed a little more fun to throw it to you guys.”
Derek van Westrum works for the National Geodetic Survey, an agency housed under the National Oceanic and Atmospheric Administration, that has the biggest catalog of those survey markers at around 1.5 million. He said the history behind the markers is extensive, but the future is downright fascinating, including an extensive project that will define a new sea level.
Survey markers and measuring elevation
Van Westrum, who is the gravity program manager for the NGS in Boulder, said survey markers are generally used for measuring two things: horizontal location, like where something would be on a map, and elevation.
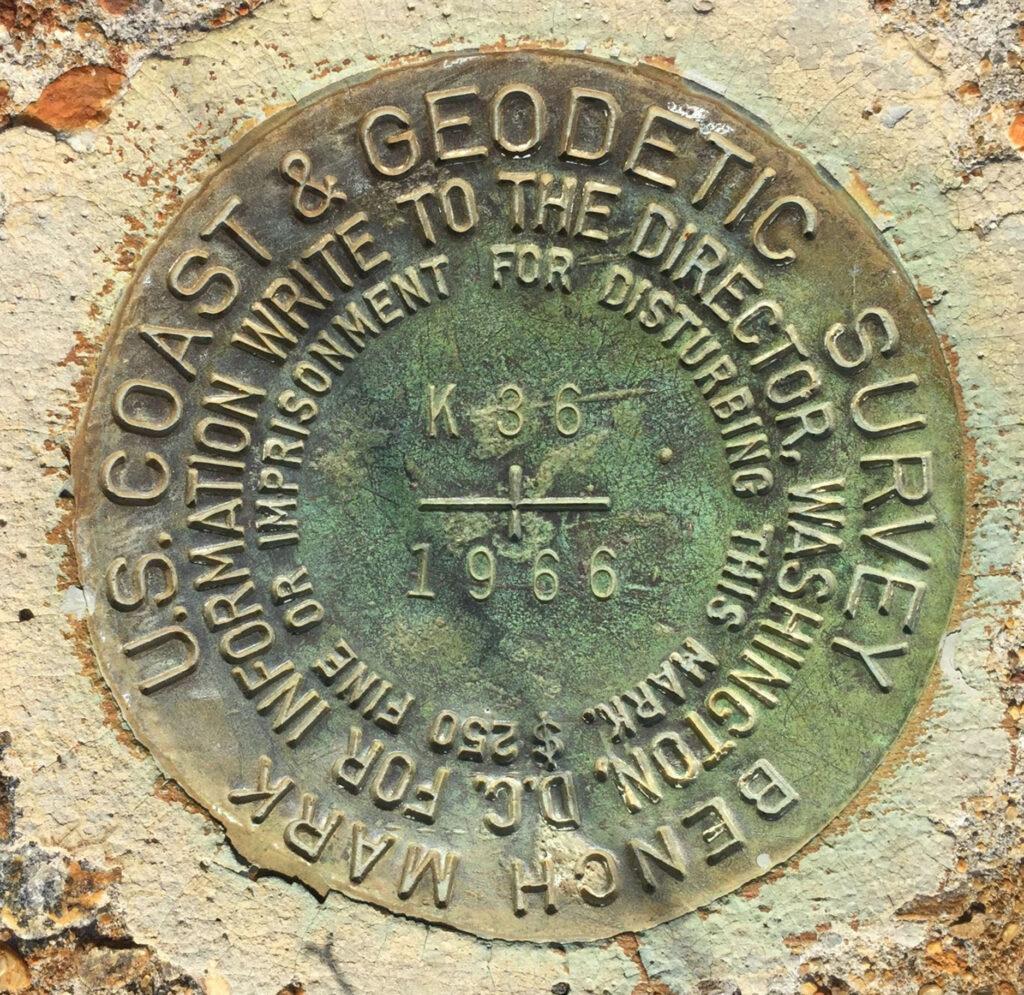
“Survey markers go back thousands of years,” van Westrum said. “I think there's evidence of Egyptians using survey markers to plot out land so that they could redistribute it after the Nile would flood. Our agency was actually the first scientific agency in the United States. Thomas Jefferson commissioned it to do a survey of the coasts. So the original name was the U.S. Coastal Survey, and then it became the U.S. Coast and Geodetic survey.”
When it comes to elevation, the markers are meant to establish baselines for which something can be measured off of. If you know the height of one mountain, you can stamp a survey marker into the rock — sometimes referred to as a benchmark, when it pertains to elevation — and measure the height of the neighboring mountain based on the elevation you know to be set in stone.
“This, again, started with Thomas Jefferson. Because we had a map of the coast, we had an idea of where the average tide line was at some location. And if you call that a zero elevation, you can then work your way inland with rulers and leveled telescopes and inch your way up from the coast up the hills into the mountains to find out how high things are,” van Westrum said. “You don't want to go back to the ocean each morning to start over. So you put benchmarks in as you go to keep track of, ‘OK, we now know we're this high’ and you keep working your way inland.”
It took about half a century to establish all those marks in the rock before they could do the math to measure elevation relative to everything else. All kinds of groups and organizations install survey markers, from universities to the NGS to the United States Geological Survey and more.
The pieces themselves are crafted specifically for measurement, van Westrum said. They’re dome-shaped so that surveyors using them can find the highpoint on the marker to measure off of. They’re largely made from brass or bronze to be corrosion-resistant and durable. And the information on them is typically to help find them in archives. Someone could call the NGS, for example, and get more information on the marker based on what’s engraved on it.
“It's typically a (nearby) town or the landowner or just the surveyor’s pet dog. I know that one from personal experience,” van Westrum said.
Unsurprisingly, the scientific and map-making community is moving beyond brass domes epoxied into rock. The survey markers have a tendency to move or be affected by changes around them.
“There's a famous poster in the San Joaquin Valley, California, where the land, because of the pumping out of the groundwater, has sunk now by something like 50 meters, just a huge amount. So any benchmarks that were placed in the 1970s or 1980s are now woefully out of date,” van Westrum said.
For horizontal measurements, GPS has largely taken over. But GPS is not as good at determining elevation, partly because it’s not working off the right data.
A new sea level
Knowing the elevation of something is particularly important when it comes to flood mapping and construction of large projects like dams or railroads. And while it’s easy to note that Pikes Peak is higher than Colorado Springs, it’s much harder if you’re designing a subdivision in what appears to be a flat area.
The gravity program van Westrum is working on hopes to get those elevation measurements as precise as possible, even accounting for the density of rock. This means moving away from the current number used for sea level, which was really just an average.
Getting that new sea level, as van Westrum’s job title suggests, involves measuring gravity itself.
“What we're doing now is we're picking basically a value of gravity times a distance from the center of the Earth and combining those,” he said. “That has a numerical value. It's something like 66 million meters squared per second squared at the current mean sea level. We're basically just defining that to be sea level. We then say, ‘OK, where is that surface under Colorado?’ And so you can actually make a map of where that value of gravity times height is under the continent. And that becomes, quote, the new sea level.”
Getting that number for the whole country involved more than a decade of survey flights.
“What we're doing is we have devices that measure the acceleration of gravity, and we make a map of that value by putting these instruments in airplanes and literally flying the entire United States on a 6-mile grid. It took 12 years,” van Westrum said.
That new baseline of sea level could then be fed to GPS data, providing the appropriate baseline to measure off of and then a truer elevation.
This information is particularly relevant for Alaska, where spotty data means it’s difficult to say which way water is flowing in significant portions of the nation’s largest state. In Colorado, it would mean significantly better information for things like construction or flood mapping. The data would even be adjustable for sea level rise due to climate change, in addition to less important matters.
“This is probably 10 times more accurate than the old system that was established in the 1980s. It really will help those flood-prone places to predict where water will flow,” van Westrum said. “And in principle, it should or could change the height of a few fourteeners, maybe shuffle things around a bit.”